09.01.2018
3.13 Aboriginal and Torres Strait Islander peoples are disproportionately represented in Australian prison populations. In 2016, Aboriginal and Torres Strait Islander people constituted just 2% of the Australian adult population but comprised more than one quarter (27%) of the national adult prison population.[25]
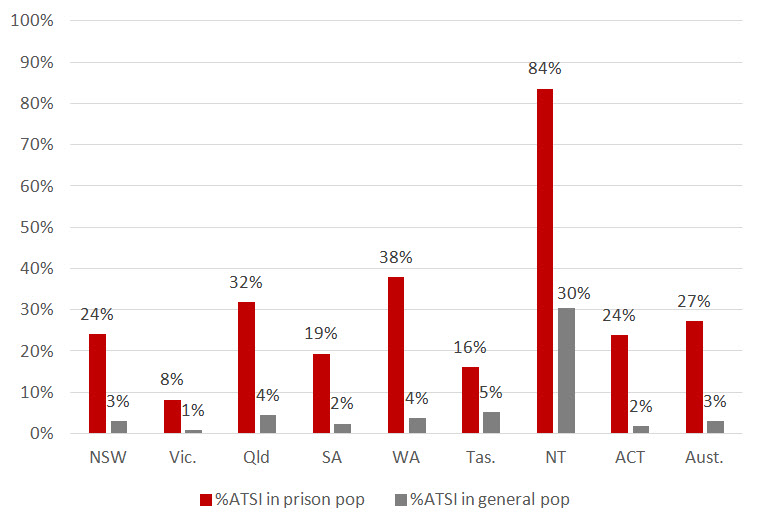
3.14 As shown in Figure 3.1 below, the extent of the over-representation varied by state and territory. For example, in the NT, Aboriginal and Torres Strait Islander peoples constituted 30% of the general population, and 84% of the prison population. In Victoria, Aboriginal and Torres Strait Islander peoples constituted 1% of the general population and 8% of the prison population.
Figure 3.1: Percentage of Aboriginal and Torres Strait Islander people in adult prison population and the general population by state and territory (2016)
State or territory | % of ATSI peoples in general population | $ of ATSI peoples in adult prison population |
|---|---|---|
NSW | 3% | 24% |
Vic | 1% | 8% |
Qld | 4% | 32% |
SA | 2% | 19% |
WA | 4% | 38% |
Tas | 5% | 16% |
NT | 30% | 84% |
ACT | 2% | 24% |
Australia | 3% | 27% |
Source: General population, Australian Bureau of Statistics, Australian Demographic Statistics, Cat No 3101 (2016) table 9 (Projected Resident Population, Series A(c)), table 12 (Projected Resident Aboriginal and Torres Strait Islander Population, Series A (c)); Adult prison population, Australian Bureau of Statistics, Prisoners in Australia, 2016, Cat No 4517.0 (2016) table 13.
3.15 One method of quantifying the extent of the over-representation of Aboriginal and Torres Strait Islander peoples in prison is to estimate incarceration rates based on the relevant Aboriginal and Torres Strait Islander adult populations and non-Indigenous adult populations. The Aboriginal and Torres Strait Islander rate was calculated by dividing the number of adult Aboriginal and Torres Strait Islander people in prison in 2016 by the total adult Aboriginal and Torres Strait Islander population estimate for 2016, and then multiplying this by 100,000 to arrive at a per capita or, more correctly, a ‘per 100,000 person’ imprisonment rate.
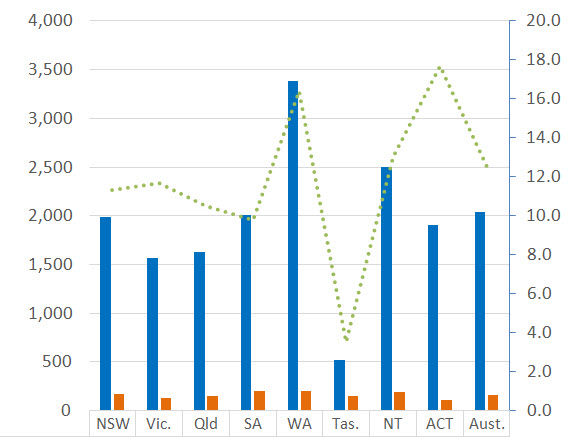
3.16 A similar rate was calculated for the non-Indigenous population. This allows comparisons to be made of the rates and assessment of the extent to which one rate exceeds the other. This is shown in Figure 3.2 below.
Figure 3.2: Imprisonment rates (per 100,000 persons) by Aboriginal and Torres Strait Islander status by jurisdiction (2016)
| NSW | Vic | Qld | SA | WA | Tas | NT | ACT | Aust |
|---|---|---|---|---|---|---|---|---|---|
ATSI | 1,992 | 1,565 | 1,626 | 2,008 | 3,383 | 523 | 2,504 | 1,904, | 2,039 |
Non-ATSI | 176 | 133 | 156 | 204 | 206 | 151 | 193 | 108 | 163 |
Over-representation ratio | 11.3 | 11.7 | 10.5 | 9.8 | 16.4 | 3.5 | 13.0 | 17.7 | 12.5 |
Source: Australian Bureau of Statistics, Prisoners in Australia, 2016, Cat No 4517.0 (2016) table 16.
3.17 As shown in Figure 3.2 above, the national imprisonment rate for Aboriginal and Torres Strait Islander peoples was 2,039 per 100,000 persons. That is, about 20 in every 1,000 Aboriginal and Torres Strait Islander people were incarcerated in 2016.
3.18 To put the rates of Aboriginal and Torres Strait Islander incarceration in perspective, the non-Indigenous rate was 163 per 100,000:less than 2 in every 1,000 persons. Aboriginal and Torres Strait Islander peoples were therefore over-represented in the imprisoned population by a factor of 12.5. In other words, based on census night statistics, Aboriginal and Torres Strait Islander people were 12.5 times more likely to be in prison than non-Indigenous people.
3.19 Figure 3.2 also shows that WA had the highest rate of imprisonment of Aboriginal and Torres Strait Islander people at 3,383 prisoners per 100,000 persons, as well as the highest rate of imprisonment of non-Indigenous people. In 2016, the Australian Capital Territory (ACT) and WA had the highest levels of Aboriginal and Torres Strait Islander over-representation in Australia (by a factor of 17.7 and 16.4 respectively). Note that, because the ACT has a small Aboriginal and Torres Strait Islander population, the ACT imprisonment rate is somewhat unstable. Caution should therefore be exercised in the interpretation of the ACT rate.
Trends in over-representation
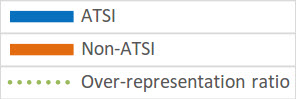
3.20 Figure 3.3 below shows that the imprisonment rate for Aboriginal and Torres Strait Islander people has increased 41% over 10 years, from 1,438 per 100,000 in 2006 to 2,039 per 100,000 persons in 2016. For non-Indigenous people, the imprisonment rate has increased by 24%, from 131 to 163 per 100,000 over the same period.
3.21 The over-representation of Aboriginal and Torres Strait Islander people in prison has increased from a factor of 11 to 12.5. In short, the gap between Aboriginal and Torres Strait Islander and non-Indigenous imprisonment rates over the decade has widened.
Figure 3.3: Changes in Aboriginal and Torres Strait Islander and non-Indigenous imprisonment rates over time (2006-2016)
2006 | 2011 | 2016 | |
|---|---|---|---|
ATSI | 1,438.6 | 1,637.8 | 2,038.6 |
Non-ATSI | 131.2 | 132.3 | 162.8 |
Over-representation ratio | 11.0 | 12.4 | 12.5 |
Source: Australian Bureau of Statistics, Prisoners in Australia, 2016, Cat No 4517.0 (2016) table 17.
The over-representation rate by ‘flow’
3.22 The rate of over-representation of Aboriginal and Torres Strait Islander people based on prison receptions derived from the ABS CCA (‘flow’) is similar to that derived from census data (‘stock)’ at 12.5. The reception-based ratio is, however, likely to be an under-estimate of the true national ratio because it does not include WA figures, and it excludes traffic related offences.
3.23 In the NT and SA, the level of Aboriginal and Torres Strait Islander over-representation in prison increases when reception-based figures are used. In the NT, the census-based ratio was 13.0 but this increases to 15.4 when reception-based prison figures are used. In SA, the census-based ratio was 9.8 but this increased to 13.7.[26]
3.24 Figure 3.4 below presents the prison reception rate across the four jurisdictions, measured through court sentencing decisions. For Aboriginal and Torres Strait Islander people, this rate was 2,200 per 100,000 persons, while for non-Indigenous people the rate was 175 per 100,000 persons—Aboriginal and Torres Strait Islander peoples were over-represented in prison receptions (across the four jurisdictions) by a factor of 12.5.
Figure 3.4: Prison reception rate (per 100,000 relevant population) by Aboriginal and Torres Strait Islander status, measured through court finalisations resulting in prison sentences (2016)
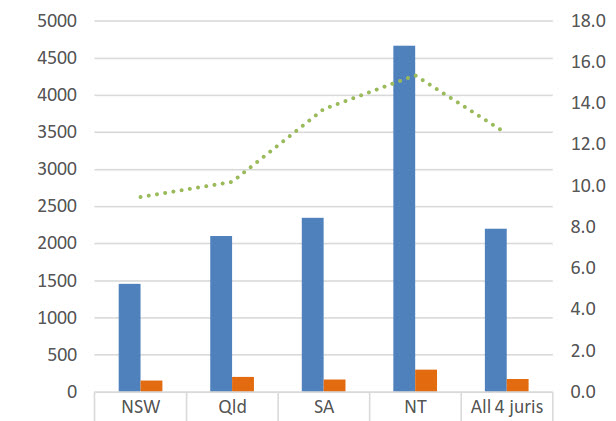
| NSW | Qld | SA | NT | All 4 jurisdictions |
|---|---|---|---|---|---|
ATSI | 1461 | 2104 | 2349 | 4670 | 2200 |
Non-ATSI | 155 | 206 | 171 | 304 | 175 |
Over-representation ratio | 9.5 | 10.2 | 13.7 | 15.4 | 12.5 |
Source: Australian Bureau of Statistics, Criminal Courts Australia, 2015-16, 45130_201516 (2017) requested table, table 3.
Aboriginal and Torres Strait Islander women
3.25 Aboriginal and Torres Strait Islander women are over-represented in prison populations. On census night, their level of imprisonment exceeded that of non-Indigenous women by a factor of 21.2—that is Aboriginal or Torres Strait Islander women were 21.2 times more likely to be imprisoned than non-Indigenous women.
3.26 The rate of imprisonment of Aboriginal and Torres Strait Islander women (464.8 per 100,000) was not only higher than that of non-Indigenous women (21.9 per 100,000), but was also higher than the rate of imprisonment of non-Indigenous men (291.1 per 100,000). See Figure 3.5 below.
Figure 3.5: Comparison of male and female imprisonment rates, by Aboriginal or Torres Strait Islander status (2016)
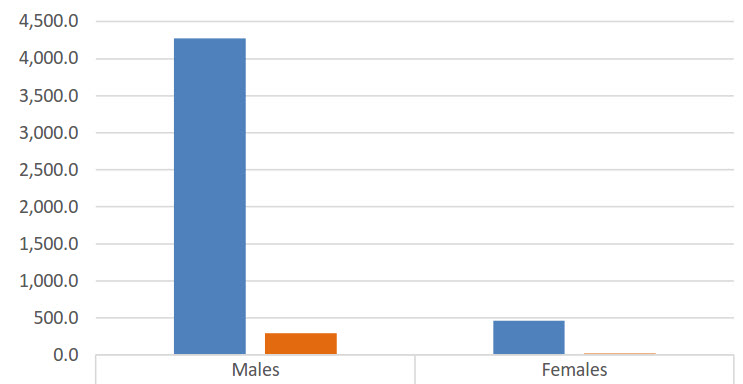
| Males | Females |
|---|---|---|
ATSI | 4,271.4 | 464.8 |
Non-ATSI | 291.1 | 21.9 |
Ratio | 14.7 | 21.2 |
Source: Australian Bureau of Statistics, Prisoners in Australia, 2016, Cat No 4517.0 (2016) table 20.
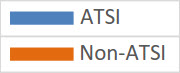
3.27 Jurisdictional variations in female imprisonment rates are shown in Figure 3.6.[27] WA presents as having the highest rate of imprisonment of women. WA also has the greatest differential between Aboriginal and Torres Strait Islander female imprisonment rates and non-Indigenous female imprisonment rates.
Figure 3.6: Jurisdictional variations in Aboriginal and Torres Strait Islander female imprisonment rates and non-Indigenous female imprisonment rates
| NSW | Vic | Qld | SA | WA | Tas | NT | ACT |
|---|---|---|---|---|---|---|---|---|
ATSI | 269.7 | 165.5 | 218.8 | 238.0 | 595.2 | 140.6 | 293.0 | 204.3 |
Non-ATSI | 16.7 | 12.5 | 19.1 | 16.8 | 27.5 | 18.1 | 24.3 | 10.0 |
Over-representation ratio | 16.2 | 13.2 | 11.4 | 14.2 | 21.6 | 7.8 | 12.1 | 20.4 |
Source: Australian Bureau of Statistics, Prisoners in Australia, 2016, Cat No 4517.0 (2016) table 20.
3.28 Since 2006, the rate of imprisonment of Aboriginal and Torres Strait Islander women has increased. As Figure 3.7 below shows, this rate increased from 365.8 per 100,000 adult Aboriginal and Torres Strait Islander females in 2006, to 464.8 per 100,000 in 2016. The rate of imprisonment of non-Indigenous women also increased but was markedly lower at just 21.9 per 100,000 adult non-Indigenous females.
Figure 3.7: Trends in the rate of imprisonment of Aboriginal and Torres Strait Islander women, 2006, 2011 and 2016
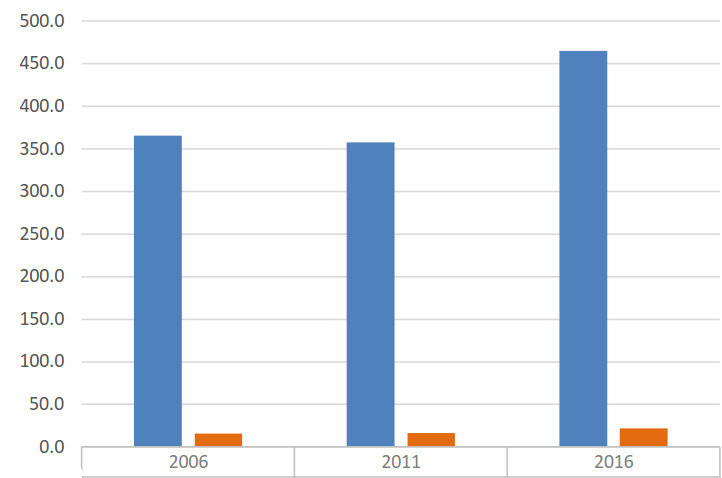
| 2006 | 2011 | 2016 |
|---|---|---|---|
ATSI | 365.8 | 357.5 | 464.8 |
Non-ATSI | 15.9 | 16.2 | 21.9 |
Source: Australian Bureau of Statistics, Prisoners in Australia – (2006) table 5 (2011) table 4 (2016) table 20.
3.29 The ALRC discusses the particular issues attached to the imprisonment of Aboriginal and Torres Strait Islander women in Chapter 11.
-
[25]
Australian Bureau of Statistics, above n 1, Aboriginal and Torres Strait Islander Prisoner Characteristics.
-
[26]
Note that in NSW, the converse is true: the census-based ratio is greater than the reception-based ratio (compare a factor of 11.3 to a factor of 9.5).
-
[27]
The rates shown are not age standardised.