09.01.2018
3.44 Aboriginal and Torres Strait Islander defendants were convicted in the same proportion as non-Indigenous defendants, but were more likely to receive a sentence of imprisonment.
3.45 The ‘conviction rate’—that is, the rate of people who enter a plea of guilty or who are proven guilty—did not vary substantially by Aboriginal and Torres Strait Islander status: 85% of Aboriginal and Torres Strait Islander defendants were proven guilty, compared with 81% of non-Indigenous defendants.
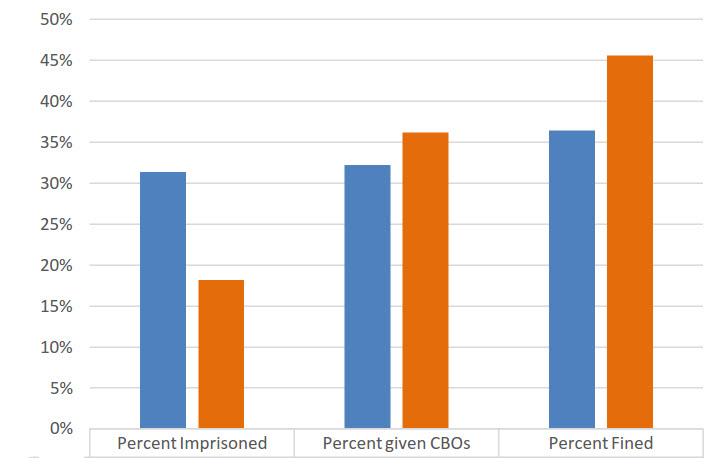
3.46 However, a greater proportion of Aboriginal and Torres Strait Islander offenders received a sentence of imprisonment. Almost one third (31%) of Aboriginal and Torres Strait Islander defendants were given custodial sentences, compared with just 18% of non-Indigenous defendants. A further third (32%) of Aboriginal and Torres Strait Islander defendants were given community service[31] (compared with 36% of non-Indigenous defendants), with the remainder issued fines (36% of Aboriginal and Torres Strait Islander defendants compared with 46% of non-Indigenous defendants). See Figure 3.11 below.
Figure 3.11: Types of penalties imposed by the criminal courts (2016)
| Percent imprisoned | Percent given CBOs | Percent fined |
|---|---|---|---|
ATSI | 31% | 32% | 36% |
Non-ATSI | 18% | 36% | 46% |
Source: Australian Bureau of Statistics, Criminal Courts, Australia, 2015–16, 45130_201516 (2017) requested table, table 3.
Penalty by offence type
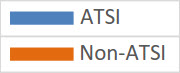
3.47 The types of penalties issued by the courts vary by offence type. For some types of offences, the types of penalties issued to Aboriginal and Torres Strait Islander offenders differed markedly from those issued to non-Indigenous offenders. For ‘acts intended to cause injury’—the most common offence type for which Aboriginal and Torres Strait Islander peoples were charged—three in every five Aboriginal and Torres Strait Islander offenders (60%) received a custodial sentence, compared with only one in three non-Indigenous offenders (30%). See Figure 3.12 below.
Figure 3.12: Types of court penalties imposed for ‘acts intended to cause injury’ (2016)
| Percent imprisoned | Percent given CBOs | Percent fined |
|---|---|---|---|
ATSI | 60% | 31% | 9% |
Non-ATSI | 31% | 47% | 22% |
Source: Australian Bureau of Statistics, Criminal Courts, Australia, 2015–16, 45130_201516 (2017) requested table, table 3.
3.48 The over-representation ratio of Aboriginal and Torres Strait Islander offenders receiving a sentence of imprisonment for ‘acts intended to cause injury’ to non-Indigenous offenders was 17.8 (908.5 per 100,000 compared with 50.9 per 100,000).
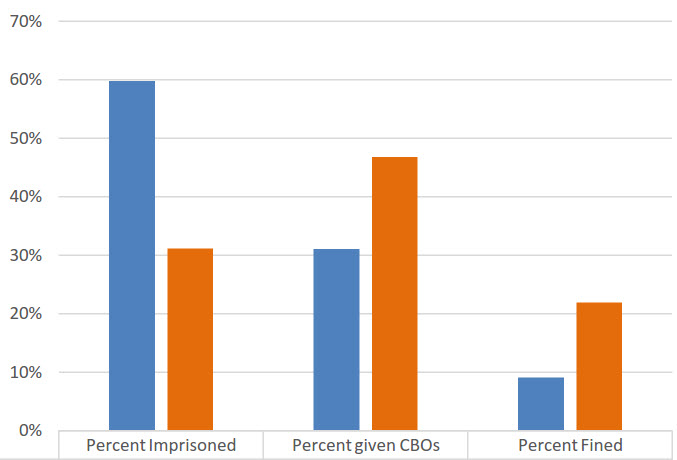
3.49 Figure 3.13 shows a similar tendency towards the use of imprisonment for Aboriginal and Torres Strait Islander offenders convicted of ‘justice-related offences’ compared with non-Indigenous counterparts, where Aboriginal and Torres Strait Islander offenders were over-represented by a factor of 21.1 (326.6 per 100,000 compared with 15.5 per 100,000).
Figure 3.13: Types of court penalties imposed for justice-related offences (2016)
| Percent imprisoned | Percent given CBOs | Percent fined |
|---|---|---|---|
ATSI | 31% | 24% | 44% |
Non-ATSI | 12% | 29% | 59% |
Source: Australian Bureau of Statistics, Criminal Courts, Australia, 2015–16, 45130_201516 (2017) requested table, table 3.
3.50 Justice procedure offending and ways to limit breaches of court orders are discussed in Chapter 7.
3.51 This pattern was not isolated to these offence categories. Table 3.4 shows that, for all offence categories except unlawful entry with intent, Aboriginal and Torres Strait Islander defendants were more likely to be handed a custodial sentence by the courts than their non-Indigenous counterparts.
Table 3.4: Penalty differences by offence type, for Aboriginal and Torres Strait Islander offenders and non-Indigenous convicted offenders (2016)
Principal offence | % of guilty defendants who are imprisoned | % of guilty defendants who get CBOs | % of guilty defendants who are issued fines | |||
| ATSI | Non-ATSI | ATSI | Non-ATSI | ATSI | Non-ATSI |
01 Homicide and related offences | 100% | 98% | 0% | 0% | 0% | 2% |
02 Acts intended to cause injury | 60% | 31% | 31% | 47% | 9% | 22% |
03 Sexual assault and related offences | 78% | 75% | 20% | 21% | 2% | 4% |
04 Dangerous or negligent acts endangering persons | 44% | 23% | 44% | 46% | 12% | 31% |
05 Abduction, harassment and other offences against the person | 40% | 29% | 38% | 44% | 22% | 27% |
06 Robbery, extortion and related offences | 83% | 75% | 17% | 25% | 0% | 0% |
07 Unlawful entry with intent/burglary, break and enter | 49% | 50% | 48% | 40% | 3% | 10% |
08 Theft and related offences | 22% | 15% | 41% | 34% | 37% | 50% |
09 Fraud, deception and related offences | 38% | 30% | 33% | 34% | 29% | 36% |
10 Illicit drug offences | 15% | 12% | 24% | 34% | 61% | 54% |
11 Prohibited and regulated weapons and explosives offences | 28% | 18% | 31% | 29% | 42% | 53% |
12 Property damage and environmental pollution | 19% | 10% | 47% | 49% | 34% | 42% |
13 Public order offences | 6% | 4% | 30% | 37% | 64% | 59% |
15 Offences against justice procedures, government security and government operations | 31% | 12% | 24% | 29% | 44% | 59% |
16 Misc offences | 12% | 5% | 29% | 26% | 60% | 69% |
Total defendants proven guilty | 31% | 18% | 32% | 36% | 36% | 46% |
Source: Australian Bureau of Statistics, Criminal Courts, Australia, 2015–16, 45130_201516 (2017) requested table, tables 1-3.
3.52 The sentencing of Aboriginal and Torres Strait Islander offenders is discussed in Chapter 6. Ways to increase access to community-based sentences for Aboriginal and Torres Strait Islander offenders are further discussed in Chapter 7, and recommendations to decrease the potential harm caused by fines are discussed in Chapter 12.