09.01.2018
3.53 ‘Stock’ statistics show that the four most common offences for which Aboriginal and Torres Strait Islander offenders were imprisoned were similar to those for which they were charged, excluding public order offences, and included: acts intended to cause injury (comprising 33% of all Aboriginal and Torres Strait Islander prisoners on census night); burglary (15%); offences against justice (11%); and robbery (11%). The offence profile of female Aboriginal and Torres Strait Islander prisoners was similar.
3.54 This can be contrasted with the four most common offences for which non-Indigenous offenders were imprisoned: illicit drug offences (comprising 17.5% of all non-ATSI prisoners on census night); acts intended to cause injury (17%); sexual assault (13%); and burglary (10%), which varied significantly from the top four offences charged.
3.55 As discussed above, ‘stock’ data are biased toward prisoners serving long sentences (i.e. serious offending). Accordingly, offenders charged with ‘acts intended to cause injury’ emerged as a significant sub-group of incarcerated offenders. Statistics which reported on ‘flow’ produce a different, though equally valid, profile of imprisoned offenders, providing insight into prisoners who commit less serious offences and receive shorter sentences. These are outlined below, and indicate that theft, public order and property offences also led to the imprisonment of Aboriginal and Torres Strait Islander peoples.
Acts intended to cause injury
3.56 ‘Stock’ data for prisoners incarcerated for ‘acts intended to cause injury’ showed some differences in the offences of Aboriginal and Torres Strait Islander populations and non-Indigenous populations in this category, where Aboriginal and Torres Strait Islander offenders were over-represented to a factor of 26.2[32] (293.4 per 100,000 compared with 11.2 per 100,000).
3.57 The majority of Aboriginal and Torres Strait Islander prisoners were incarcerated for serious assault resulting in injury. A greater proportion of Aboriginal and Torres Strait Islander offenders were incarcerated for assaults that did not result in injury (compare 30% of Aboriginal and Torres Strait Islander with 17% of non-Indigenous). Aboriginal and Torres Strait Islander offenders were grossly over-represented in the cohort of offenders imprisoned for ‘serious assault not resulting in injury’, making up 56% of all people imprisoned for that offence category.
Table 3.5: Further breakdown of prisoners who are incarcerated for ‘acts intended to cause injury’ (2016)
Sub categories of ‘acts intending to cause injury’ | Aboriginal and Torres Strait Islander people | Non-Indigenous | ||
| number and % charged with acts intending to cause injury | % charged with sub category | number and % charged with acts intending to cause injury | % charged with sub category |
0211 Serious assault resulting in injury | 2,072 (59%) | 41% | 2,998 (62%) | 59% |
0212 Serious assault not resulting in injury | 1,063 (30%) | 56% | 832 (17%) | 44% |
0213 Common assault | 307 (9%) | 30% | 719 (15%) | 70% |
029 Other acts intended to cause injury | 92 (3%) | 25% | 275 (6%) | 75% |
TOTAL | 3,534 (100%) | 42% | 4,825 (100%) | 58% |
Source: Australian Bureau of Statistics, Prisoners in Australia, 2016, Cat No 4517.0 (2016) requested table, table 1.
Offences against justice
3.58 A similar more detailed analysis of the people who were incarcerated for justice procedure offences on census night also revealed some differences between the Aboriginal and Torres Strait Islander populations and non-Indigenous populations, and clearly illustrated the disproportionate representation of Aboriginal and Torres Strait Islander peoples in these offence types—Aboriginal and Torres Strait Islander peoples constituted 34% of all people imprisoned for ‘justice-related’ offending.
Table 3.6: Further breakdown of prisoners who are incarcerated for justice-related offences (2016)
Sub categories of ‘offences against justice procedures, government security and government operations’ | Aboriginal and Torres Strait Islander people | Non-Indigenous | ||
| number and % charged with justice-related offences | % charged with sub category | number and % charged with justice-related offences | % charged with sub category |
151 Breach of custody | 55 (5%) | 44% | 70 (3%) | 56% |
152 Breach of community-based orders | 718 (62%) | 31% | 1573 (69%) | 69% |
153 Breach of Violence Orders/Non-Violence Orders | 344 (30%) | 46% | 398 (18%) | 54% |
154 Offences against gov ops | 8 (1%) | 14% | 50 (2%) | 86% |
155 Offences against gov security | 3 (0%) | 7% | 40 (2%) | 93% |
156 Offences against justice | 36 (3%) | 21% | 139 (6%) | 79% |
TOTAL | 1,164 (100%) | 34% | 2,270 (100%) | 66% |
Source: Australian Bureau of Statistics, Prisoners in Australia, 2016, Cat No 4517.0 (2016) requested table, table 1.
3.59 Aboriginal and Torres Strait Islander peoples were over-represented in ‘offences against justice procedures’ by 16.8[33] (129 per 100,000 compared with 7.7 per 100,000 for non-Indigenous offenders).
‘Flow’ statistics regarding offences leading to imprisonment
3.60 ‘Flow’ offence profiles showed that less serious offences also led to sentences of imprisonment for Aboriginal and Torres Strait Islander offenders, such as ‘theft’, ‘public order’ and ‘property damage’ offences.[34]
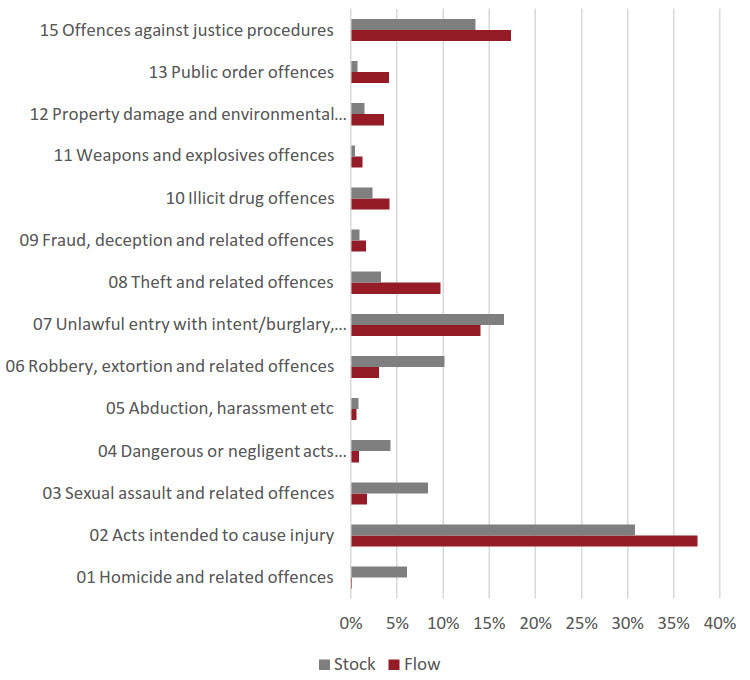
3.61 The differences between ‘stock’ and ‘flow’ figures are clearly shown in Figures 3.14 and 3.15 below. ‘Stock’ data generate a picture of a prison population heavy with serious offenders and longer sentences. ‘Flow’ data shows that Aboriginal and Torres Strait Islander peoples were also being imprisoned for low-level offending for short periods of time.
3.62 Figure 3.14 illustrates the difference in the offence profile of Aboriginal and Torres Strait Islander prisoners via the ‘stock’ and Aboriginal and Torres Strait Islander ‘flow’ populations. As the Figure shows, less serious offences—such as theft offences, public order offences, and property damage—feature more prominently in the ‘flow’ profile, along with acts intended to cause injury and justice procedure offending.
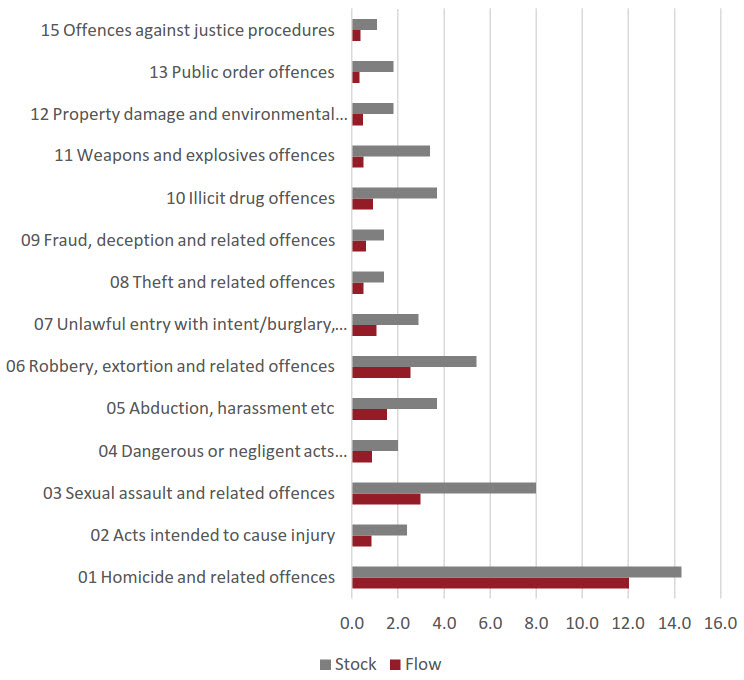
3.63 Figure 3.15 shows the comparable sentence lengths in years, and highlights the difference between ‘stock’ and ‘flow’ estimates, with flow statistics showing significantly shorter sentences than stock. Together Figures 3.14 and 3.15 show why reliance on just one set of data can skew understandings of the constitution of the prison population.
Figure 3.14: Comparison of the offence profile of Aboriginal and Torres Strait Islander prison ‘stock’ (census) and prison ‘flow’ (reception) populations (2016)
Stock-Flow Offence profile for ATSI prisoners (ex traffic) | Flow | Stock |
|---|---|---|
01 Homicide and related offences | 0% | 6% |
02 Acts intended to cause injury | 38% | 31% |
03 Sexual assault and related offences | 2% | 8% |
04 Dangerous or negligent acts endangering persons | 1% | 4% |
05 Abduction, harassment etc | 1% | 1% |
06 Robbery, extortion and related offences | 3% | 10% |
07 Unlawful entry with intent/burglary, break and enter | 14% | 17% |
08 Theft and related offences | 10% | 3% |
09 Fraud, deception and related offences | 2% | 1% |
10 Illicit drug offences | 4% | 2% |
11 Weapons and explosives offences | 1% | 0% |
12 Property damage and environmental pollution | 4% | 1% |
13 Public order offences | 4% | 1% |
15 Offences against justice procedures | 17% | 13% |
16 Miscellaneous offences | 0% | 0% |
Source: Australian Bureau of Statistics, Criminal Courts, Australia, 2015–16, Cat No 4513.0 (2017) table 51; Australian Bureau of Statistics, Prisoners in Australia, 2016, Cat No 4517.0 (2016) table 10.
Figure 3.15: Comparison of the average sentence length by year of Aboriginal and Torres Strait Islander prison ‘stock’ (census) and prison ‘flow’ (reception) populations (2016)
Stock-Flow Offence profile for ATSI prisoners (ex traffic) | Mean sentence length (yrs): Flow | Mean sentence length (yrs): Stock |
|---|---|---|
01 Homicide and related offences | 12.0 | 14.3 |
02 Acts intended to cause injury | 0.9 | 2.4 |
03 Sexual assault and related offences | 3.0 | 8.0 |
04 Dangerous or negligent acts endangering persons | 0.9 | 2.0 |
05 Abduction, harassment etc | 1.5 | 3.7 |
06 Robbery, extortion and related offences | 2.5 | 5.4 |
07 Unlawful entry with intent/burglary, break and enter | 1.1 | 2.9 |
08 Theft and related offences | 0.5 | 1.4 |
09 Fraud, deception and related offences | 0.6 | 1.4 |
10 Illicit drug offences | 0.9 | 3.7 |
11 Weapons and explosives offences | 0.5 | 3.4 |
12 Property damage and environmental pollution | 0.5 | 1.8 |
13 Public order offences | 0.3 | 1.8 |
15 Offences against justice procedures | 0.4 | 1.1 |
16 Miscellaneous offences | 0.6 | 1.8 |
Total (ex traffic) | 0.8 | 3.4 |
Source: Australian Bureau of Statistics, Criminal Courts, Australia, 2015–16, Cat No 4513.0 (2017) table 51; Australian Bureau of Statistics, Prisoners in Australia, 2016, Cat No 4517.0 (2016) table 10.
3.64 The ALRC discusses short sentences of imprisonment in Chapter 7, with preference for the expansion of community-based sentences, where appropriate. Further data relevant to short sentences of imprisonment is presented below.